
Summary. Measuring employee success beyond sales roles requires a structured approach, and performance metrics frameworks provide the solution. By using a well-designed performance matrix, organizations can define clear performance measures that are objective, fair, and transparent, combining quantitative outcomes with qualitative competencies. Properly implemented performance metrics reduce bias, improve retention of high performers, and ensure consistent evaluations across teams. Omni’s platform centralizes and automates this process, allowing HR leaders and managers to design, track, and analyze performance metrics in real time, integrate peer and manager feedback, and generate actionable insights—all within a flexible, scalable system. With Omni, businesses can transform traditional performance measures into a dynamic, data-driven performance metrics framework that supports growth, accountability, and continuous development.
Why Use Performance Metric Frameworks?
The Challenge
If you've ever struggled to measure performance for roles like software engineers, product managers, or operations specialists, you're not alone. While sales and revenue-driving roles come with built-in scorecards, most other roles require intentional design to measure fairly and effectively.
The cost of getting this wrong is high:
- Bias creeps in when managers rely on gut feelings.
- High performers leave when they can't prove their impact.
- Inconsistency grows as different managers apply different standards.
- Legal risks increase when performance decisions can't be defended.
The Solution
This template provides a structured approach to building performance metrics that are:
- Objective: Based on measurable outcomes, not opinions.
- Fair: Consistent across similar roles and managers.
- Transparent: Clear expectations from day one.
- Balanced: Combines quantitative data with qualitative judgment.
- Practical: Can be implemented without extensive technical infrastructure.
Who This Article Is For
- HR leaders building performance management systems.
- People managers setting expectations for their teams.
- Startup founders establishing appraisal systems as they scale.
- HR business partners supporting multiple departments with varied needs.
What You'll Accomplish
By the end of this process, you'll have:
- A clear understanding of what success looks like for the role.
- 6-10 quantitative metrics tied to business outcomes.
- 4-6 qualitative competencies with defined proficiency levels.
- A complete performance scorecard ready to share with your team members.
- An implementation plan for rolling out your new performance metrics.
Getting Started
Before You Choose Your Framework
Gather these resources:
- Job description for the role(s) you want to assess.
- Company/department OKRs or goals.
- Access to any existing performance metrics and data.
- Calendar time with the role holder (for later feedback).
- Input from 2-3 people who work closely with this role.
Answer these questions:
- What does this role exist to accomplish?
- How would we know if someone is excelling vs. struggling?
- What friction is encountered when reviewing this role's performance?
- What data do we already collect that might indicate performance?
Build Role Profiles
Purpose: Create a comprehensive picture of the role before defining performance metrics.
What to do:
Section A: Basic information
- Fill in role details
Section B: Core responsibilities
- List 3-5 primary responsibilities (not tasks)
- Assign time allocation (must total 100%)
- Identify primary stakeholders for each
How to write good responsibilities:
Good: "Define and execute product roadmap for core platform features."
Too vague: "Product management."
Too granular: "Write user stories in Jira."
Section C: Success definition
- Think 6-12 months ahead
- Be specific: What would be measurably different?
- Focus on outcomes, not activities
Template: "When someone excels, [stakeholder] would have [specific outcome] because this person [delivered what]."
Example: "When someone excels, Engineering would have clear, well-researched requirements that reduce rework because this person conducted thorough user research and translated insights into actionable specs."
Section D: Key challenges
- Be honest about measurement difficulties.
- Identify what's currently subjective but could be objective.
Why this matters: Understanding challenges helps you design better metrics. If you note "success depends on collaboration," you'll remember to build in peer feedback.
Outcome & Metric Mapping
Purpose: Transform each responsibility into measurable outcomes and specific performance metrics.
For each responsibility:
1. Define the desired outcome
- What does success look like?
- What changes in the organization?
2. Identify 2-4 potential performance measures
- Must be specific and measurable
- Should have a clear target
- Must have an accessible data source
3. Complete all metric fields:
- Metric name
- Definition (formula if applicable)
- Data source
- Current baseline (if known)
- Target
- Measurement frequency
- Data owner
Metric quality checklist
For each metric, ask:
- Can we actually track this data?
- Does the person have a meaningful influence over this metric?
- Will this metric drive the behavior we want?
- Is the target achievable but challenging?
- Would we be happy if someone optimized for this metric?
Warning signs
- Vanity metrics: Look good but don't drive behavior (e.g., "lines of code").
- Lagging indicators only: No leading indicators that predict success.
- Too many metrics: More than 12 total becomes unmanageable.
- Unmeasurable: Data doesn't exist or is prohibitively hard to collect.
Using the "Stuck?" prompts
If you're struggling to identify performance measures, use these four prompts as a starting point:
1. "What data already exists?"
Look at your existing tools: analytics, project management, CRM, support tickets
2. "What would high performers' numbers look like?"
Think about past top performers—what did they achieve?
3. "What leading indicators predict success?"
What early signals tell you something will work?
4. "How do stakeholders know someone's doing well?"
What do they point to? Can that be quantified?
Qualitative Assessment Framework
Purpose: Define the competencies that matter and how to assess them objectively.
Competency selection
- Review pre-populated competencies
- Check 4-6 most critical for this role
- Add custom competencies if needed
How to choose competencies:
Priority 1: Role-defining competencies (without these, the role fails)
Priority 2: Growth enablers (these separate good from great)
Priority 3: Cultural values (your company's non-negotiables)
Competency rubric builder
For each selected competency, define:
- Why this matters for this specific role
- Four proficiency levels:
- Developing
- Proficient
- Advanced
- Expert
- Behavioral examples for each level
- How to assess (peer feedback, manager observation, etc.)
Writing effective rubrics:
Good: "Advanced: Leads architecture discussions; reviews others' code; shares best practices across team."
Too vague: "Advanced: Very good at technical work."
Too subjective: "Advanced: Has great technical intuition."
The specificity test: Could two different managers rate the same person consistently using your rubric? If not, add more specific behavioral examples.
Omni tip: Look at industry-standard competency frameworks as starting points (engineering ladders, PM frameworks, etc.), then customize for your organization.
Performance Scorecard Builder
Purpose: Combine quantitative and qualitative into a complete, weighted scorecard.
Define rating scale
- Choose a 4-point or 5-point scale (we recommend a 5-point).
- Review the definitions for each rating level.
- Ensure everyone will interpret ratings consistently.
Read next: How to Determine the Best Performance Rating Scale for Your Team
Weight your performance metrics
- List all quantitative metrics
- Assign weights (should total 60-70%)
- List all qualitative competencies
- Assign weights (should total 30-40%)
- Verify total equals 100%
Weighting guidelines:
Quantitative metrics:
- Most important metrics: 10-15% each
- Secondary metrics: 5-10% each
- Supporting metrics: 3-5% each
Qualitative competencies:
- Critical competencies: 8-12% each
- Important competencies: 5-8% each
- Supporting competencies: 3-5% each
The balance question: If someone scores perfectly on quantitative but poorly on qualitative (or vice versa), what overall rating feels right? Adjust weights accordingly.
Complete performance scorecard
This section is used during actual performance reviews:
- Rate each metric/competency 1-5.
- Add evidence and specific examples.
- System auto-calculates weighted scores.
- Review final performance rating.
- Document strengths and development areas.
Best practices for evidence:
- Be specific: dates, numbers, examples.
- Mix positive and constructive feedback.
- Include stakeholder quotes when available.
- Note patterns across multiple performance metrics.
Framework Selection Guide
There are five distinct frameworks for measuring performance. Each works best for different role types. Here's how to choose a suitable performance matrix:
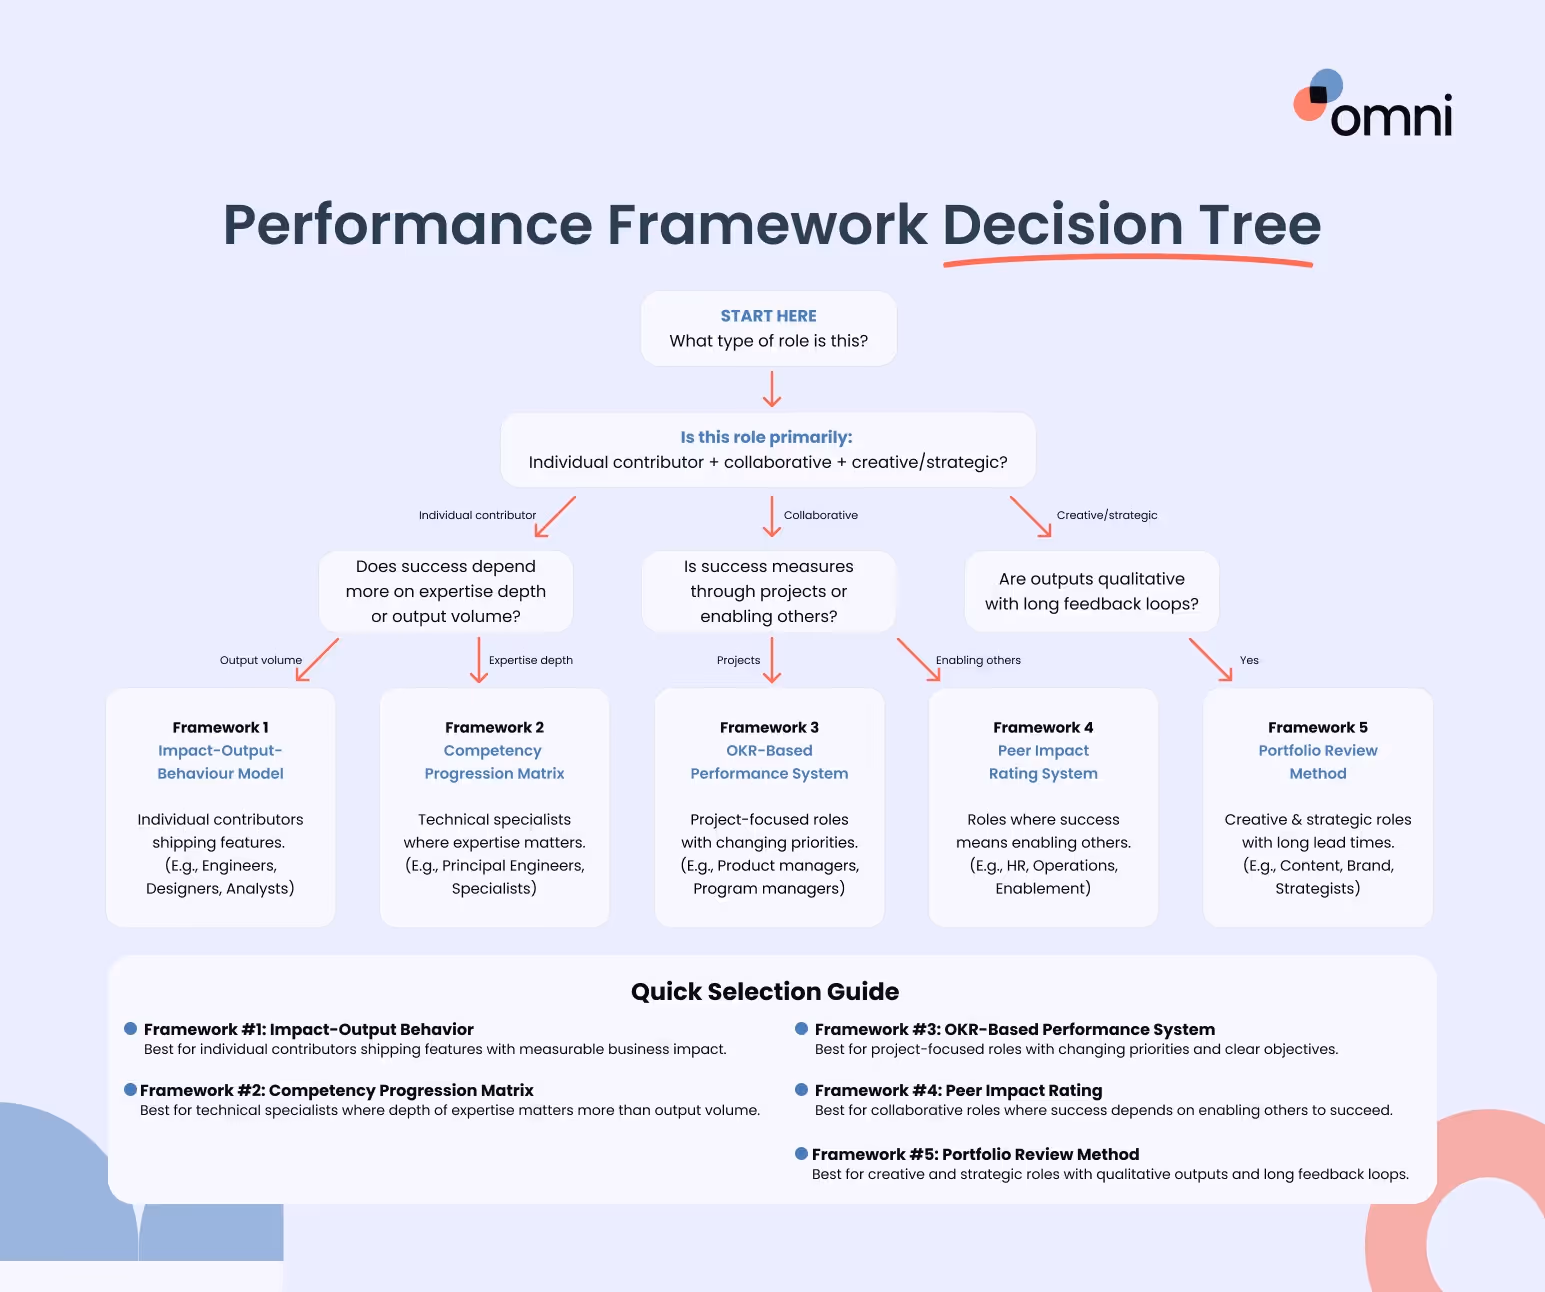
Framework #1: Impact-Output-Behavior Model
Best for: Individual contributors in product, engineering, design, and research.
Structure:
- 40% Impact (business outcomes)
- 30% Output (work delivered)
- 30% Behavior (how they work)
When to use: When you can draw a line from individual work to business results, but collaboration and working style also matter significantly.
Example roles: Software engineer, product designer, data analyst, UX researcher
Key advantage: Balances "what" they produce with "how much it matters" and "how they do it."
Framework #2: Competency Progression Matrix
Best for: Technical specialists and roles where expertise compounds over time.
Structure:
- Define 5-7 core competencies
- Map 4-5 proficiency levels for each
- Measure progression over time
When to use: When skill development is more important than output volume, or when you want to reward deep expertise.
Example roles: Staff/principal engineers, senior technical specialists, researchers
Key advantage: Makes career progression transparent and reduces pressure to constantly produce more.
Framework #3: OKR-Based Performance System
Best for: Project-focused roles with changing priorities
Structure:
- 60% OKR achievement
- 20% Execution quality
- 20% Behavioral competencies
When to use: When work naturally organizes into objectives and key results, and priorities shift quarterly.
Example roles: Product managers, operations managers, strategic program leads
Key advantage: Creates a clear line of sight from individual work to company goals.
Framework #4: Peer Impact Rating System
Best for: Highly collaborative roles where success means enabling others.
Structure:
- 40% Peer impact ratings
- 30% Contribution quantity
- 30% Contribution quality
When to use: When most value comes from cross-functional collaboration, and it's hard to isolate individual output.
Example roles: Technical program managers, HR business partners, internal operations
Key advantage: Captures the reality of modern work where value often comes from making others successful.
Framework #5: Portfolio Review Method
Best for: Creative and strategic roles with qualitative outputs.
Structure:
- 40% Quality (expert assessment)
- 30% Impact (business outcomes)
- 30% Growth (skill development)
When to use: When work is inherently subjective, but you want a structured evaluation, or when outcomes take months to materialize.
Example roles: Content creators, brand designers, marketing strategists
Key advantage: Respects the nature of creative work while providing structure
Learn more: 5 Frameworks for Measuring Performance in Roles Without Clear Metrics
Can I Use Multiple Frameworks?
Yes, most organizations use a hybrid approach. Some common combinations include:
Omni tip: Don't combine more than two frameworks, or complexity becomes overwhelming.
Implementation Checklist
Purpose: Ensure the successful rollout of your new performance metrics
Phase 1: Design (Weeks 1-2)
- Complete building:
- Role profiles
- Outcome & metric mapping
- Qualitative assessment frameworks
- Performance score cards
- Review with HR or senior leadership
- Refine based on feedback
Phase 2: Alignment (Weeks 3-4)
- Critical: Share draft with role holder and gather input
- Adjust based on employee feedback
- Calibrate with other managers if multiple people have this role
- Confirm data collection methods work
- Set up any needed tracking or dashboards
Phase 3: Launch (Week 5)
- Communicate final performance metrics to the employee
- Clarify measurement cadence and review schedule
- Make performance metrics visible (share dashboard access, etc.)
- Schedule first check-in
Phase 4: Ongoing management
- Monthly: Quick review of quantitative metrics
- Quarterly: Full performance conversations
- Biannually: Revisit performance measures if the role has evolved
- Annually: Comprehensive review and goal-setting
Success indicators:
You'll know implementation is working when:
- Employees can explain how they're measured.
- Performance metrics are tracked consistently without constant follow-up.
- Performance conversations feel objective and fair.
- You can complete a review in <2 hours.
- Employee performance is improving over time.
- Both the manager and the employee trust the system.
Best Practices for Creating Performance Metrics
Start with outcomes, not activities
Wrong approach: Measure what someone does
- "Attends 20 customer calls per month."
- "Writes 10 user stories per week."
- "Sends daily status updates."
Right approach: Measure what they accomplish
- "Achieves 85% customer satisfaction score."
- "Delivers features that drive 5% engagement increase."
- "Stakeholders report high alignment on priorities."
The "so what" test: For every metric, ask "so what?" If the answer isn't tied to business value, reconsider the metric.
Balance leading and lagging indicators
Ideal ratio: 60% lagging, 40% leading
Why it matters: Lagging indicators confirm success; leading indicators allow course-correction.
Make metrics controllable
The control test: Can this person meaningfully influence this metric through their actions?
Too little control:
- Engineer measured on company’s revenue (depends on sales, market).
- Designer measured on customer churn (many factors outside design).
Appropriate control:
- Engineer measured on code quality and feature delivery.
- Designer measured on usability scores and design system adoption.
Gray area: What about team metrics?
Solution: Use team metrics to show impact, but ensure individual contributions are visible.
Ensure data accessibility
Before finalizing any metric, confirm:
- The data source exists and is reliable.
- Data can be accessed without excessive manual work.
- Data is updated frequently enough for meaningful feedback.
- Multiple people can verify the data (not in one person's head).
Reality check: If collecting data takes more than 30 minutes per month, either:
- Automate it
- Simplify the metric
- Choose a different metric
Set realistic targets
Target-setting approaches:
1. Historical performance:
Look at the past 6-12 months → Set target 10-15% higher
2. Industry benchmarks:
Research industry standards → Adjust for your context
3. Strategic goals:
Work backward from company OKRs → Define required individual performance
4. Pilot and calibrate:
Set provisional targets → Adjust after one quarter of data
Warning signs of bad targets:
- Everyone easily exceeds the target (too low)
- No one hits the target (too high)
- Target hasn't changed in 2+ years (may be outdated)
- No rationale for why the target was chosen (arbitrary)
Avoid unintended consequences
The optimization problem: People will optimize for what you measure.
Examples of performance metrics gone wrong:
"Lines of code written."
→ People write bloated, unnecessary code
"Support tickets resolved."
→ People close tickets quickly without solving problems
"Features shipped"
→ People ship low-quality features to hit numbers
How to avoid this:
- Pair quantity with quality metrics
"Features shipped" + "Bug rate in production" - Include stakeholder satisfaction
Ensures gaming metrics don't degrade the experience - Review unintended behaviors quarterly
Ask: "Are people doing weird things to hit metrics?"
Keep it simple
The manager test: If a manager can't complete a performance review in under 2 hours, simplify.
Common Pitfalls to Avoid
Pitfall #1: Measuring everything
The problem: When everything is a metric, nothing is a priority.
What it looks like:
- 20+ metrics in the scorecard
- Performance measures covering every tiny aspect of the job
- Analysis paralysis during reviews
The fix:
- Focus on 8-12 metrics that matter most
- Ask: "If we could only measure 3 things, what would they be?"
- Use the 80/20 rule: What 20% of metrics predict 80% of performance?
Pitfall #2: Pure quantitative or pure qualitative
The problem: All numbers = losing important context. All feelings = bias creeps in.
What it looks like:
All quantitative:
- Missing critical soft skills
- Can't capture collaboration, leadership, culture fit
- Gaming metrics become a problem
All qualitative:
- "Exceeds expectations" with no data to back it up
- Inconsistency across managers
- Impossible to track improvement
The fix:
- 60-70% quantitative, 30-40% qualitative
- Make qualitative assessment structured (rubrics, examples)
- Require evidence for all ratings
Pitfall #3: Set-and-forget metrics
The problem: Business changes, but performance metrics don't.
What it looks like:
- Measuring features shipped when quality is now the priority
- Same targets year over year despite team maturity
- Metrics don't align with the current company strategy
The fix:
- Quarterly: Quick relevance check
- Biannually: Adjust performance metrics if the role has evolved
- Annually: Comprehensive review and refresh
Pitfall #4: Metrics without context
The problem: Numbers without the story behind them are meaningless.
What it looks like:
- "You shipped 8 features (target: 10) — Below expectations"
- Ignoring: market shift, technical debt paydown, team member departure
The fix:
- Always include space for context and evidence
- Look at trends, not single data points
- Ask "why" before judging performance
Pitfall #5: Surprise metrics
The problem: Revealing metrics during the review instead of upfront.
What it looks like:
- Employee doesn't know how they're measured until review time
- Goals set by the manager without employee input
- No visibility into current performance
The fix:
- Share metrics when setting goals (or during onboarding)
- Co-create metrics with the employee when possible
- Make current performance visible (dashboards, regular check-ins)
Pitfall #6: Comparing apples to oranges
The problem: Using identical metrics for roles that are different.
What it looks like:
- All engineers measured the same (frontend, backend, infrastructure)
- Same customer satisfaction target for new CSM and tenured CSM
- Ignoring context: team size, product maturity, market conditions
The fix:
- Create metric families, not rigid templates
- Customize targets based on context
- Run calibration sessions to ensure fairness
Pitfall #7: Ignoring leading indicators
The problem: Only measuring outcomes after it's too late to change course.
What it looks like:
- Measuring only quarterly results
- No early warning signals
- Course-correction happens too late
The fix:
- Include leading indicators in your metrics mix
- Check them more frequently than lagging indicators
- Act on leading indicators to improve lagging outcomes
Frequently Asked Questions
1. Should every person in the same role have identical metrics?
Same framework and similar metrics, but customized for their specific responsibilities and seniority level. For example, two product managers might both track "feature adoption," but have different targets based on their product area.
2. How many total metrics should one person have?
8-12 total (6-8 quantitative, 4-6 qualitative). More than 12 becomes unmanageable.
3. Can metrics change mid-year?
Yes, if business priorities shift significantly. But try to keep them stable for at least one quarter so you can measure trends.
4. What if we don't have the data to track these metrics?
Start with what you can track, and build infrastructure over time. Better to measure 5 things well than 10 things poorly.
5. What if someone's performance depends heavily on factors outside their control?
Adjust for context in your assessment. For example, if market conditions hurt all product adoption rates, note that when reviewing individual performance. Also consider using team-level metrics alongside individual metrics.
6. Should I include metrics that are already part of their job description?
Yes—if they're important outcomes. The point is to measure what matters, even if it's "obvious" from the job description.
7. What's the difference between a goal and a metric?
A goal is what you're aiming for ("Improve user engagement"). A metric is how you measure progress toward that goal ("Increase WAU by 10%"). Goals provide direction; metrics provide measurement.
8. Can I use the same metric for multiple roles?
Yes, if they both influence that outcome. For example, both PM and Engineering Lead might track "On-time feature delivery," but you'd note their different contributions in the evidence.
9. Isn't qualitative assessment still subjective?
A: Yes, but structured subjectivity is much better than unstructured. Rubrics with behavioral examples and multi-source feedback significantly reduce bias.
10. How do I assess soft skills objectively?
A: Use specific behavioral examples and multiple perspectives. Instead of "good communicator," collect evidence: "Presented roadmap to board; stakeholders rated presentation 4.5/5" or "Engineering team reports clear, detailed specs in 90% of projects."
11. Should I include company values in competency assessment?
A: Yes, if living those values is truly expected. But make them measurable—define what each value looks like in action for this specific role.
12. How do I handle pushback from managers who don't want to use this system?
Understand their concerns first. Common worries:
- Too time-consuming → Show how automation reduces burden
- Too rigid → Demonstrate customization options
- Doesn't capture the full picture → Include space for qualitative context
If resistance continues, make it clear this is about fairness and consistency, not optional.
13. What if an employee refuses to participate in setting their metrics?
A: Understand why. Are they afraid of being measured? Do they distrust the process? Address root concerns. If they still refuse, you can proceed without their input, but document that you tried to involve them.
14. How do I handle someone who's a 5 on quantitative but a 2 on qualitative?
A: That's what weighted scoring is for. If quantitative is 70%, they could still score ~4.0 overall (exceeds expectations). But use the review conversation to address the qualitative gap—it matters for long-term success.
15. Should I tell someone their score, or just the rating?
Share both. Transparency builds trust. Show them exactly how you calculated their score.
16. What if someone is consistently a "3" (meets expectations) but never exceeds? Is that a problem?
A: Not necessarily. "Meets expectations" means they're doing their job well. If they're content in their role and not seeking advancement, that's fine. If they aspire to grow, focus on development.
17. How does Omni help with performance metrics and performance management?
Omni centralizes, automates, and analyzes your entire performance process so HR and managers can drive continuous improvement with real data instead of manual tracking. With Omni, you can:
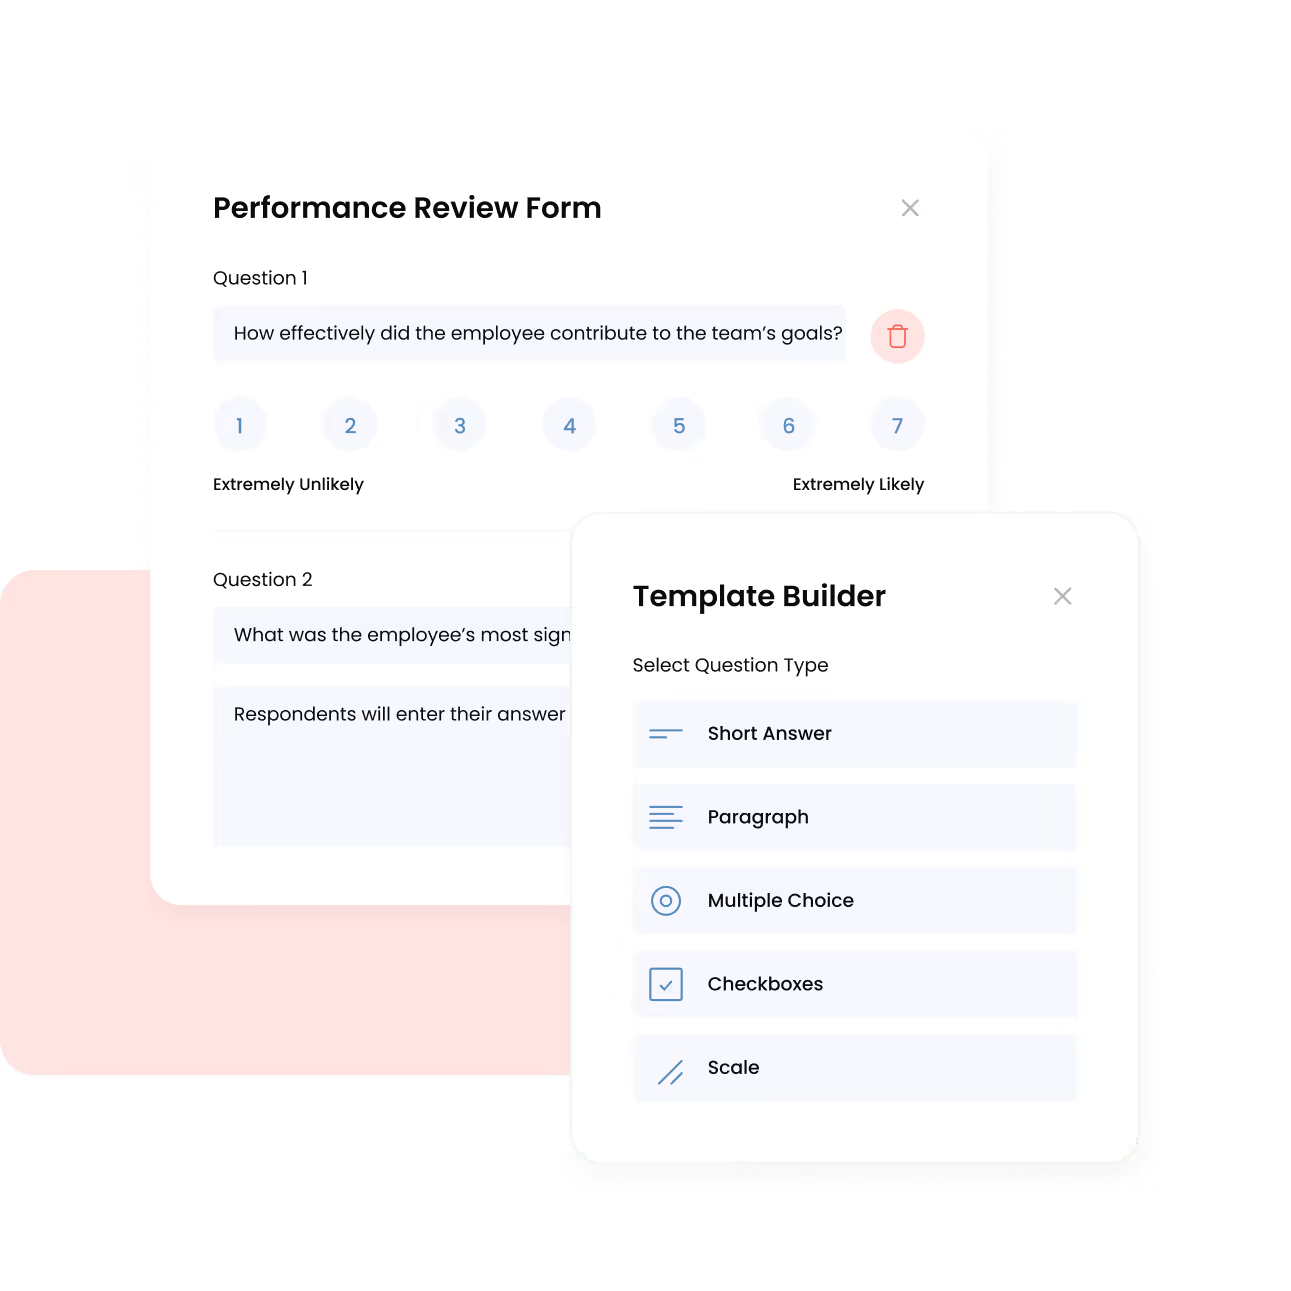
- Run structured review cycles at scale: Create fully customizable performance review templates, launch scheduled review cycles, and manage 360° feedback across teams, all from one central location.
- Track goals and OKRs in real time: Monitor individual and team goals with clear progress visualization, enabling managers to conduct ongoing check-ins and identify performance gaps early, not just at annual reviews.
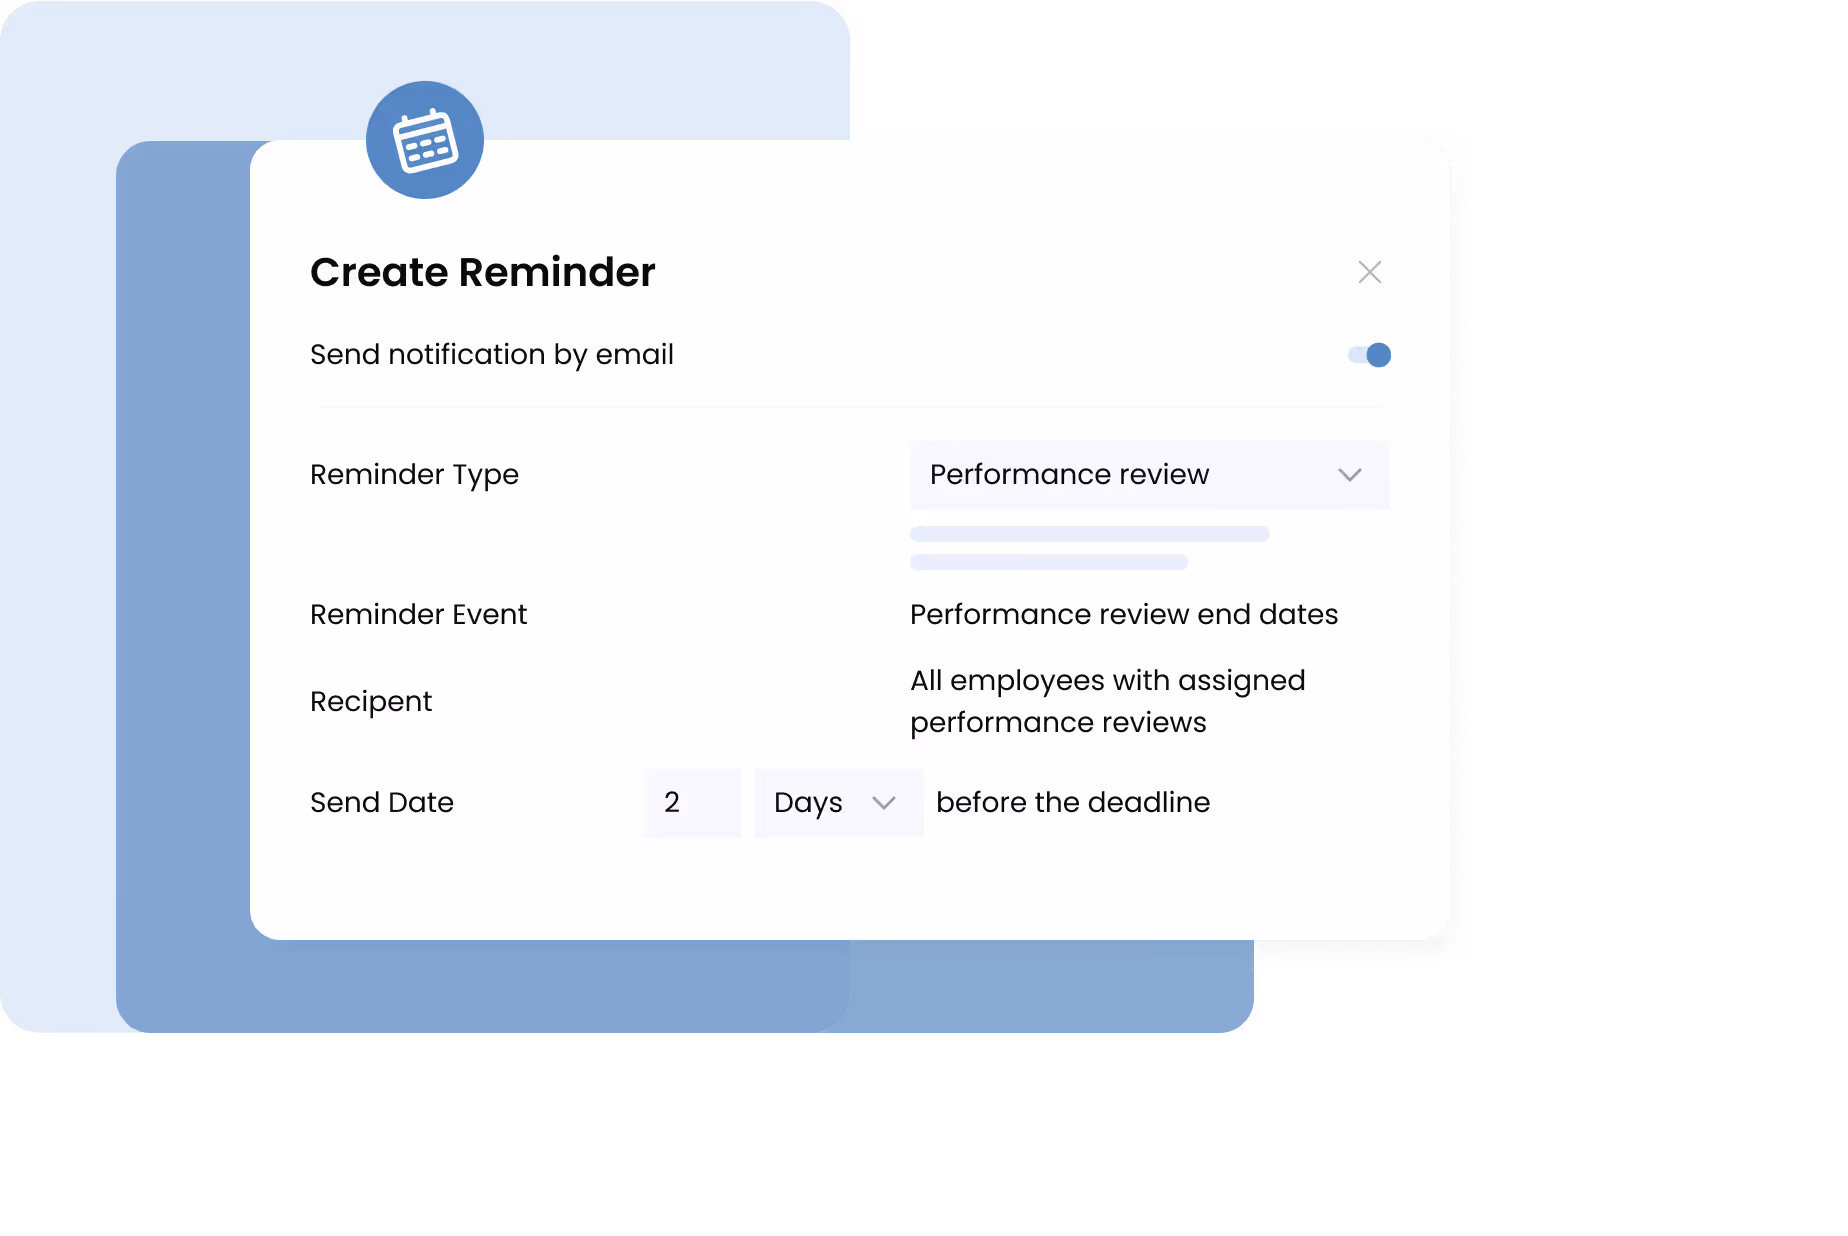
- Automate reminders and approvals: Trigger automated notifications to employees and managers for self-assessments, peer reviews, and manager evaluations, ensuring review timelines stay on track without manual follow-ups.
- Gain actionable performance insights: Build custom analytics dashboards to track performance trends, identify high performers, monitor engagement risks, and surface development needs across departments, teams, or countries.
- Connect performance data with HR and payroll records: Combine performance metrics with attendance, leave, compensation, and payroll data to support fair evaluations and evidence-based workforce planning.
With Omni’s automated workflows, OKR tracking, and customizable analytics, performance management shifts from a once-a-year administrative task into a continuous, measurable process that actively supports employee development and business growth.
How Omni Supports Performance Management
The Manual Performance Management Challenge
If you're managing performance with spreadsheets, you're likely facing:
- Data collection headaches: Manually gathering metrics from 5+ tools
- Version control issues: Which spreadsheet is the latest?
- Limited visibility: Employees can't see their current performance
- Time-intensive reviews: Hours spent compiling information
- Difficulty spotting trends: Hard to see patterns across the team
How Omni Solves These Problems
Omni is a modern, all-in-one HR platform that automates performance management while giving you the flexibility to design, run, and measure performance frameworks that fit your business across roles, teams, and countries.
Key Capabilities for Performance Management
1. Flexible performance frameworks
Build fully customizable performance programs without rigid templates or one-size-fits-all scoring.
- Create customized review templates tailored to any framework (OKRs, competency models, scorecards, KPI-based reviews).
- Set different competencies, goals, and rating scales by team, role, or country.
- Adjust weightings, scoring models, and goal structures as your business evolves.
- Support mid-cycle updates and quarterly check-ins without rebuilding workflows.
Example: Your product team runs quarterly OKRs while engineering uses an Impact-Output-Behaviour scoring model; both frameworks run simultaneously in Omni with role-specific review templates and scoring criteria.
2. Automated data collection
Reduce manual tracking by capturing performance inputs directly within your HR workflows.
- Pull goal progress, manager inputs, and peer feedback through integrated review forms.
- Centralize self-reviews, manager ratings, and feedback into each employee profile.
- Connect performance data with existing employee records, attendance trends, and payroll history.
Result: No spreadsheets, no manual consolidation, all performance data is captured automatically within Omni’s performance cycles.
3. Real-time visibility
Remove blind spots with real-time performance dashboards.
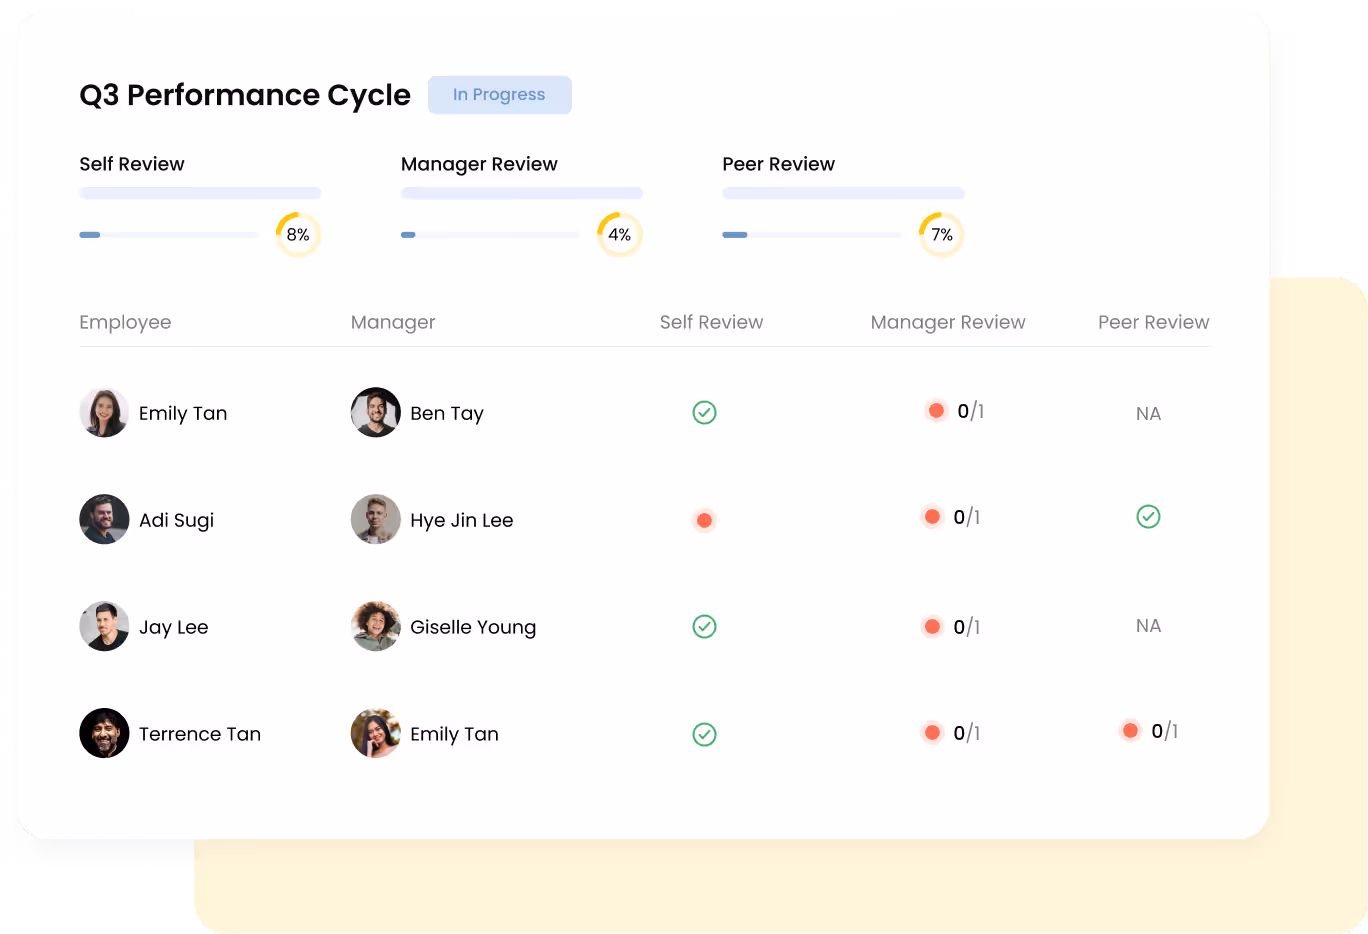
- Track goal progress and review completion rates in real time.
- Monitor department, team, and individual performance trends.
- Identify review bottlenecks and delayed check-ins instantly.
- Visualize OKR progress mid-cycle before final evaluations.
Example: Managers can spot missed milestones across teams during quarter-end reviews and intervene early, instead of waiting until annual assessments.
4. Streamlined Review Process
Keep reviews on schedule without endless follow-ups.
- Guided workflows for self-reviews, manager reviews, and approvals.
- Automated deadline reminders to employees and managers.
- Status tracking dashboards showing who has completed or missed each stage.
- Centralized access to reviews, historical scores, and feedback discussions.
Result: Reviews move from fragmented email chasing to fully automated workflows that stay on track from launch to completion.
5. 360-Degree Feedback
Collect structured, actionable insights across teams.
- Launch peer, cross-functional, and upward feedback surveys.
- Choose anonymous or attributed feedback depending on your culture.
Example: For your "cross-functional collaboration" competency, Omni automatically gathers feedback from teams across departments, consolidates recurring themes, and displays insights directly within the employee’s performance record.
6. Analytics and Insights
Transform performance data into workforce decision-making tools.
- Build custom analytics dashboards to track performance trends.
- Export audit-ready reports for leadership reviews and workforce planning.
- Identify coaching opportunities and promotion readiness.
Result: Promotions, salary adjustments, and development planning become data-driven decisions instead of subjective assumptions.
Built for Growing Teams
- Multi-country compliance: Manage performance processes across 190+ countries while supporting region-specific compliance and local requirements.
- Built for APAC: Designed with Asia businesses' workflows and cultural nuances in mind, while supporting global teams across 10+ languages.
- Scales effortlessly: Works seamlessly for 20 employees or 2,000+ across multiple locations.
- Flexible implementation: Performance workflows adapt to your processes, not the other way around, with customization and configuration support from dedicated account managers.
Learn more about Omni’s performance management:
- Download our free Performance Metrics Builder Template to get started.
- Book a demo and see Omni in action.


.png)
.png)


